Data
Find annual reports, data dashboards, and point in time reports below.


211 Virginia Reports
-
 Data
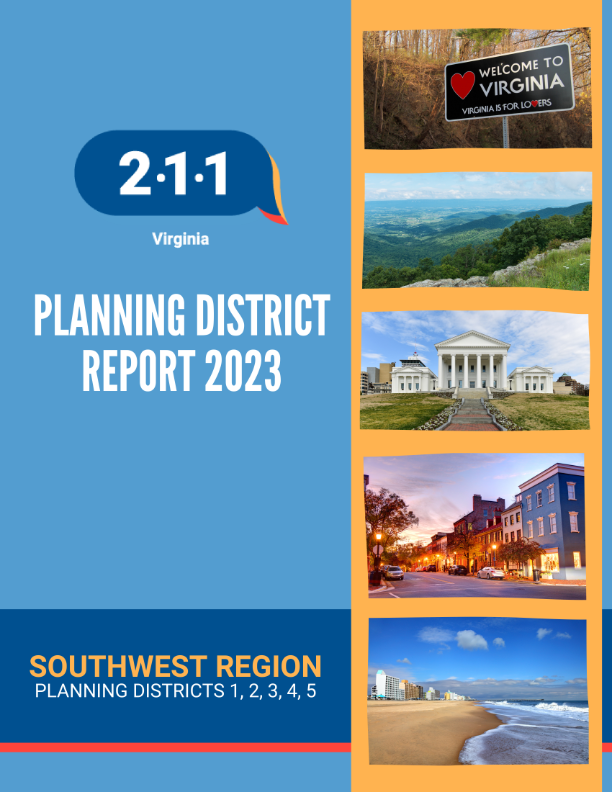
2023 Southwest Region Planning District Report
Data
2023 Southwest Region Planning District Report
-
Data
2023 Northwest Region Planning District Report
-
Data
2023 Northern Region Planning District Report
-
Data
2023 Richmond/Southside Planning District Report
-
Data
2023 Central Region Planning District Report
-
Data
2023 Southeast Region Planning District Report
-
 Data
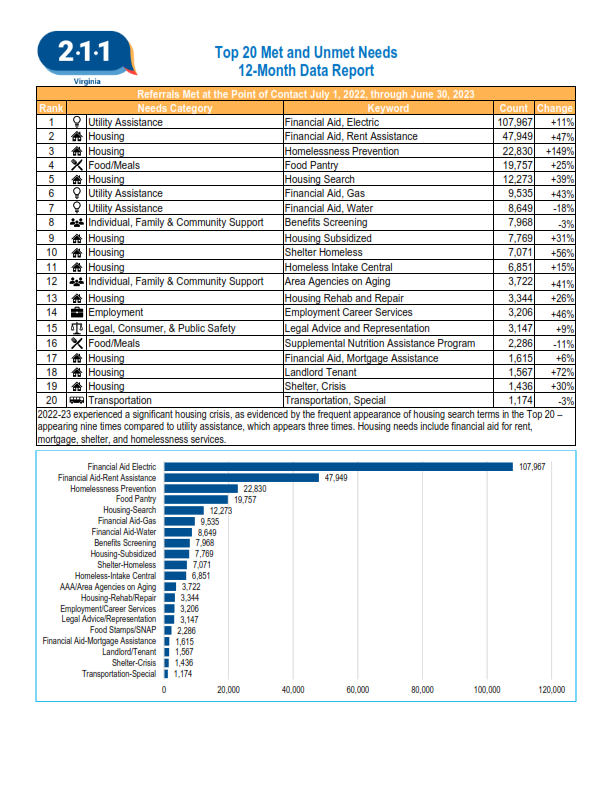
2022-2023 Housing Needs and Assistance Report
Data
2022-2023 Housing Needs and Assistance Report
-
 Data
2022-2023 Top 20 Met and Unmet Needs
Data
2022-2023 Top 20 Met and Unmet Needs
-
 Data
2022-2023 211 Virginia Annual Report
Data
2022-2023 211 Virginia Annual Report
Community Needs Assessment and Demographics
Data Dashboards
-
 Data
2-1-1 Counts
Data
2-1-1 Counts
2-1-1 Counts is the first tool to provide real-time, searchable and visual presentation from 2-1-1 VIRGINIA. 2-1-1 Counts provides a snapshot of community-specific needs displayed by zip code or region as recently as yesterday, enabling individuals, community leaders and service agencies to check trends, make comparisons and share information. 2-1-1 Counts uses Census Data and has the ability to overlay with 2-1-1 data.
-
 Data
City Health Dashboard
Data
City Health Dashboard
Where you live determines a lot about your health – and, as the new City Health Dashboard shows, there’s a lot of vital information to check up on. The dashboard, created by the Department of Population Health at NYU School of Medicine, reports on 36 key measures and drivers of health, such as opioid overdose deaths, obesity, housing affordability, and income inequality.
The tool drills down to the zip code or census tract level in the 500 largest cities in the United States, allowing you to compare health outcomes to the country’s average. You can generate maps of health measures, compare cities on different indexes, and even generate scatter plots to draw out correlations between variables.